AI Capability Continuum:
A Three Step Framework to Understand the Capability Growth of AI systems
In recent years, the field of Artificial Intelligence (AI) has
witnessed remarkable progress, with many breakthroughs now accessible
through APIs and open-source solutions. Thanks to this increased
accessibility and ease of implementation, it has led organizations,
ranging from fledgling startups to Fortune 100 MNCs, to actively
integrate AI into their products and services.
However, amidst this surge in adoption, significant challenges remain.
One major hurdle is the high failure rate of AI projects in the
industry. According to a recent survey [1], a staggering 96% of AI projects
encounter data issues during the training phase, preventing them from
progressing further. Another survey [2] reveals that despite substantial
investments, 8 out of 10 companies reported minimal or no return on
investment (ROI) from their AI efforts.
These findings underscore the need for addressing critical issues
in AI implementation to ensure successful outcomes and maximize the
potential benefits of this rapidly evolving technology.
In this article, we present the
“AI Capability Continuum”, a three-step framework tailored to help
you conceptualize the development and assess the capabilities of AI
systems. To elucidate this framework effectively, we will utilize the capability curve.
Executive Summary
-
The article introduces a three-step framework for developing AI
systems in industry the right way so as to maximize ROI from AI efforts.
-
Interestingly, the shape of the capability growth curve for AI systems differs
significantly from that of traditional software systems.
-
The reason for this lies in the distinct needs of developing AI
systems, best described by the three phases of the proposed
framework
-
The first phase involves laying the foundations and not focusing on
model building.
-
The second phase focuses on quickly moving from 'a' AI system to a
'very good' AI system.
-
The third phase is about pushing boundaries, get to 'The' system.
-
We also explore how off-the-shelf LLMs such as ChatGPT affect the
capability curve, enabling rapid sales & testing the markets.
CAPABILITY CURVE OF
TRADITIONAL SOFTWARE
SYSTEM
Consider the following: as one implements more n more parts of a software system, its
capabilities (things it is able to do) keep on increasing. If one were to draw a 2D curve with Yaxis as capability
and X-axis as time, and draw growth in software’s capability with time, How
would that curve look like?
Engineers started writing software in the 1970s. Over the past five
decades, humans have deeply understood and mastered every aspect of
software development right from requirements gathering to development, all
the way to on-premise deployment and maintenance. Given mankind’s mastery
of software development process, the capability curve for standard software
projects/systems is illustrated in Figure 1.
Let us now understand the why the shape of this
curve is the way it is :
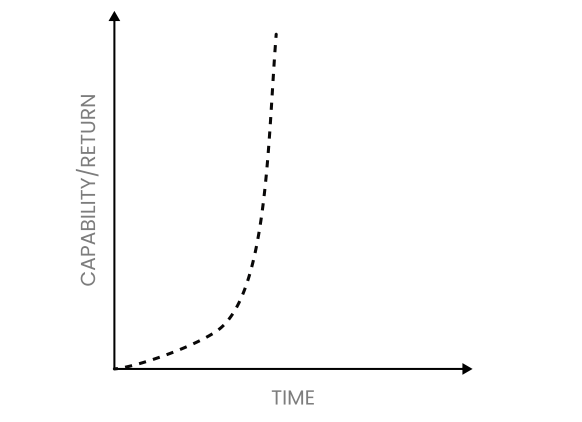
Fig 1:Capability curve for a typical software/IT system
Initially, starting a typical IT/software development project demands time and effort—gathering
requirements, scoping, budgeting, and assembling the right team. During this inception phase, the
capability grows slowly, resulting in the capability curve with a flat slope. But once we are past this
initial stage, the capability
curve of the software system rises steeply. Within a few days/weeks of
starting the development, one starts to see the gains
materialize pretty quickly, creating a steep
rise in the curve. Powerful and efficient development tools, frameworks, programming languages,
agile methodology, tools, extensive software development experience, cloud computing,
collaborative development platforms coupled with automation and DevOps have contributed
significantly to the hockey stick shape of this curve.
CAPABILITY CURVE OF
AI SYSTEM
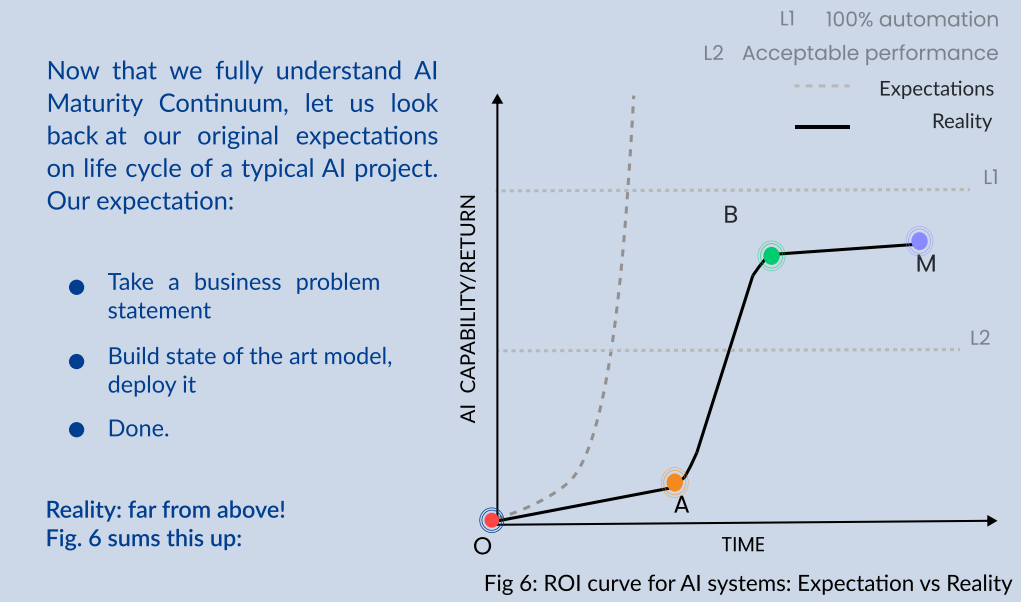
When it comes to the capability curve of a typical AI project/system, any guesses what the shape
might look like? it is very different:
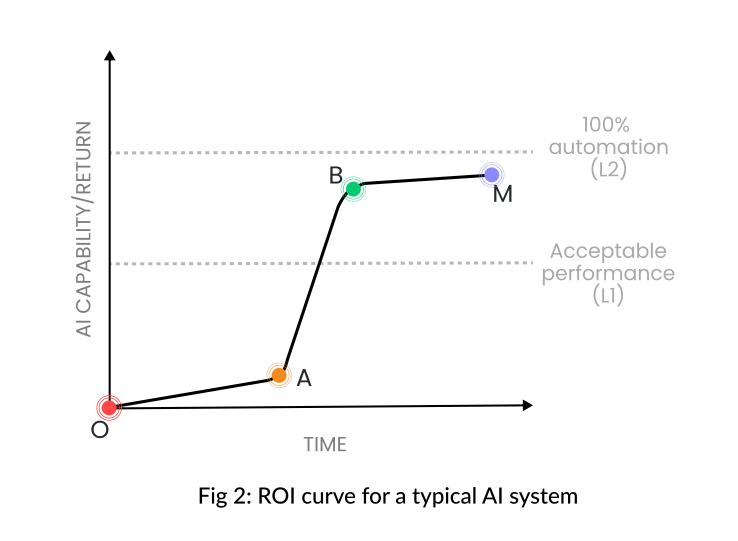
Fig 1:ROI curve for a typical AI system
Immediately one sees distinct similarities and notable differences between this curve
and previous one. In contrast to Fig 1 (on previous page), the initial segment of the
curve in Fig 2 remains remarkably flat for an extended duration, resulting in a more
elongated form. Subsequently, it ascends fast, albeit not as sharply as in Fig 1. Most
intriguingly, towards the conclusion, the curve stagnates sharply.
This shape of capability curve for AI surprises many industry practitioners, especially
those with extensive software engineering background. Founders, CXOs, leaders, and
managers often anticipate an AI system's capability curve to mirror that of software
systems, (resembling a hockey stick). However, this is far from reality.
Reason? The long-standing, well-understood playbooks of software development do not
work for AI development. This greatly impacts the capability curve for AI. Let us try to
understand this better and uncover why the shape of the curve changes. To
do so, we
divide the curve into three main segments: Foundation Zone (O-A), Acceleration Ramp
(A-B), and Maturity Plateau (B-M) and then look at
each segment in detail as under. The
attempt is to better understand AI development and write its playbook.
FOUNDATION ZONE (O-A)
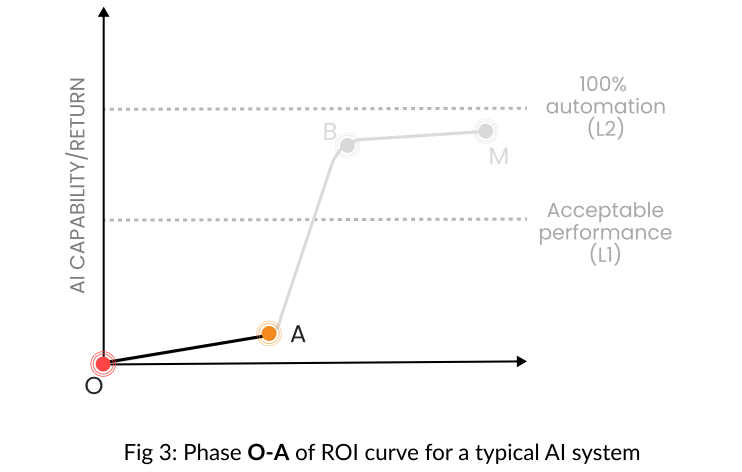
In Foundation Zone, the focus should be solely on setting up the game correctly. The
following are the major steps involved:
- Develop a better understanding of the (vague) business problem
-
Convert the (often vague) business problem statement into a
well-defined business problem statement
-
Evaluate if the problem statement (in 2) is even an AI problem or not
-
Define the success metrics of the solution - both business and ML
metrics
-
Understand the kind & quantity of data needed to solve the AI problem.
-
Understand if your organization has the kind & quantity of data
needed in the preceding step
-
Get the data needed, preprocess & clean it, and create a v0
dataset from it
-
Understand the broader kind of AI problem at hand - supervised,
unsupervised, reinforcement learning etc
- In case of supervised learning, get the v0 dataset labeled.
-
Understand the constraints your solution must adhere to:
- Cost of mistake/wrong prediction
- Prediction time - Real-time or batch?
- Compute location - cloud or edge?
-
Any other constraints the solution must adhere to
- Time to prediction, explainability of prediction etc
-
Build a model -
often a simple model/baseline, even 3rd party API
-
Quickly get to test the core business hypothesis- does your solution
solve a major pain point for the end user (or business unit) or not?
How likely is it to see PMF?
- If Yes, how much is the market willing to pay for it?
Depending on the difficulty of the problem at hand, the AI maturity/literacy
within the
organization and the time to test the core thesis, typically this phase can take anywhere
between 30 days to even 6 months! Typically the hardest pieces in this phase often proves to
be aspects
around dataset preparation and testing the core hypothesis.
Observations
-
The most common mistake that a lot of teams/organizations make is that from day 1,
they get
down to building ‘the’ model. They believe anything less than state of the art Large Language
Models (LLMs) is unacceptable. This should never be the aim of this
phase.
The purpose of Foundation phase is to understand the fundamental aspects
of the problem - are we solving the right problem, is the problem at
hand is even an AI problem or can be solved using traditional
approaches, do we have the kind of data that is needed to solve the
problem well. Most importantly: is our overall
solution/product/service a pain killer or a vitamin for the market
and what kind of price market is willing to pay for it?
Why do we say so? Because AI is an expensive technology - massive
datasets, hardware for compute, AI talent; none of it comes cheap.
There is no point in building a state-of-the-art model for a problem
where each prediction costs you $3 but the market is not willing to
pay you more than $1 per prediction (or worst - market shows no
interest in your solution). There is no way you can build a viable
business from it.
Also, building a great model is hard and takes time. You need a very
good understanding of the problem, great team in terms of skillset,
even greater datasets and heavy compute (in case of deep learning).
You should not invest time & resources of this level, unless one is
very sure of being able to build a viable business from it.
Any seasoned entrepreneur knows that building a business from
scratch is extremely challenging (which is why successful ones are called unicorns). Numerous variables affect
success. So, why obsess over having a state-of-the-art model from the start?
-
The objective of this phase must be to attack the hardest part of the
problem - it is not building the best model (unless you are a pure
research lab). The hardest part is to answer questions on business
direction:
-
Are we building something that solves a major pain point (pain
killer vs vitamin)
-
Does the AI system seem to meet its business objectives? Ex: Alexa
was a great AI product but failed to meet its business goals i.e.
power more orders from Amazon.com
-
Would users/clients be willing to pay for it ? If yes, then how
much?
-
Do you think you can extract enough LTV to offset the high dev
cost, indirect costs and margins to build a long term profitable
business?
This is a fundamental difference when doing AI in product companies vs
academia/ research labs. Academia/Research Labs are focused on
advancing state-of-the-art. To drive home the point check 'thought
experiment' on the next page
-
In mature organizations, data is systematically organized for quick
access by internal consumers like AI teams. This is akin to a
well-organized pantry in a professional kitchen, enabling chefs to
create dishes swiftly. Conversely, in organizations lacking data
strategy, data is stored haphazardly, akin to dumping ingredients into
cold storage. Retrieving specific data becomes a time-consuming
project in its on, greatly hindering AI projects, a common oversight
among founders and executives.
In most organisations, that do not have data maturity, most AI
projects die in the O-A phase itself! Thus, if you are serious about
AI, getting your data strategy right is very important.
-
Many teams, founders, and executives often overlook the vital step of
establishing appropriate success metrics and measurement methods,
fixating solely on the model. It's crucial to systematically define AI
and business metrics, ensuring their correlation. Getting this right
from day one is akin to building a rocketship without a control panel,
especially in AI, where systems are stochastic and prone to errors,
impacting accuracy and effectiveness quantification.
-
You may wonder, we never talked about the model or underlying
algorithm. Use any model/algorithm that gets the job done - 3rd party
API, open source or even humans producing predictions in real time! As
we argued earlier, it is wrong to invest in building a great model in
this phase. Aim should be to quickly assemble a system and test the
markets right-away.
-
If you are not training your own v0 model, you can downplay the
dataset creation & labelling steps. But do keep in mind that once your
project goes beyond point A, you will need good dataset to train
models - it is always best to start this early to better understand
the risk to the project.
This phase also explains why the age old corporate wisdom of getting
some “early wins” does not hold true in AI projects/systems. As evident,
O-A is a hard phase and getting early wins is super hard.
To summarize, the mantra for this phase should be “Quickly assemble a
system & test the market”.
Acceleration Ramp (A-B)
This is the middle part of the curve in Fig. 4 - Acceleration Ramp. Here you get the highest
progress/capability per unit effort.
A lot of hard work is already done into Foundation. You have already put in place a lot of
key ingredients - refining problem statement, collecting data, operationalizing metrics &
measurement methodology, and early validation from stakeholders (internal/external). In
the next phase one focuses mainly on improving the model - going from a model to the model. Key steps in this phase:
- You try various algorithms and build various models.
- Rigorously benchmark the performance of every model built
- Once your system crosses the acceptable performance level (L1), you take your
AI system to production and expose predictions to end user
- As you keep improving, you keep pushing out best model so far to production.
- Test the new model and system thoroughly, replace the existing model with the
new model, and monitor the gain in ML metrics and business metrics
Keep Iterating previous steps. You will start moving quickly from a model to much
better models. At some point, your gains will start to saturate. This is when you know
that you are at point B. Depending on the problem at hand and AI maturity within the Org/Team, this
phase can typically last from 3-12 months.
Observations
-
This phase starts, when your product/offering s value proposition
starts to find traction in the market. The carefully orchestrated
demos with which you tested the market landed well. Early customers
have started to come, some even paid customers.
Now, given the traction, it is crucial that you must greatly ramp up
the AI capabilities of your system. This is a great time to usher A-B
phase. This is where you focus on the core model!
-
Note that this phase has a lot of iterations within it.
-
This phase is all about going from a model (simpler approaches) to
the model (complex approaches). Why not try the best algorithm
upfront? Occam's razor - a fundamental tenet of AI. The objective is
to find the simplest model that works the best.
-
Since comparing 2 or more candidate models is a key part of this
phase, the ground work we did on metrics, measure methodology &
rigorous test sets in the previous phase forms the bed rock of this
phase & comes super handy. Without that it becomes hard to
critically compare various models.
-
At each step, you closely analyze the kind of mistakes your model is
making. Often, it is in this analysis lies the genesis of the next
model.
-
As you get to better models, you keep taking them to production. This
is where you go from 1st version of your AI system to maybe 3rd or 4th
version of your AI system
-
At some point, your gains will start to saturate, thats when you know
you are close to point B.
Briefly, this phase is all about “Make it Better”.
Maturity Plateau (B-M)
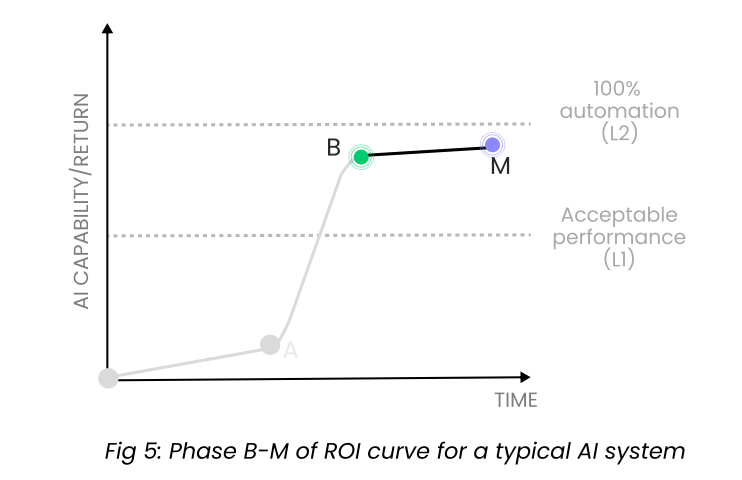
This is the tail end of the journey. The curve starts to tapper - your
gains again start to move very slowly. This phase is about pushing the
system to its limits:
-
Your team is building 20/30/40th model; 5th/7th/10th version of
system.
- You try to push systems performance to its limits.
-
Your team is looking into every single edge case that your AI system
is getting wrong.
-
Your team is tweaking n trying new approaches/algorithms/neural
network architectures and not just applying known AI algorithms.
-
Your team is tinkering with the very underlying mathematics of the AI
algorithms and coming up with new mathematical formulations.
-
After a lot of efforts, typically the model performance improves only
by 1-2%
This phase is typically can last from 6 to 24 months depending on the
difficulty of the problem at hand.
Observations:
-
This phase mostly happens only when the AI problem at hand is at
the very core of your business and your business is doing very well
- you have a lot of traction, a lot of paying customers, who not
only love your product but also refer it to others (network
effect).
-
Even 1-2% gain in the AI capability will move your business numbers
significantly. Say, 10-20% growth in revenue or the number of paying
customers etc.
-
Most AI projects seldom get to this stage.
-
This phase is all about first principles approach to model building -
opening and rebuilding the very underlying math of the model grounds
up.
-
Notably, capability curve beyond M never touches L2 (100% automation).
This is because today’s AI is far from AGI - missing the ability to
learn from its mistakes and keep improving. No matter what use case
you are solving for, and how good a model your team builds, you will
always have a long tail of edge cases your system will keep getting
wrong. AI lives in long tail of these edge cases. This has huge
implications on your company’s profit margins, but we will cover this
some other day.
-
AI lives in the long tail of edge cases: progress comes very slowly.
Why? Complexity of handling edge cases. More advanced the model,
greater its accuracy; necessitating higher-quality and more accurate
data for further enhancements
-
Instead of exponential improvement in performance, paradoxically one
sees exponential increase in the expenses and efforts required for
further. Ex: Self Driving Cars
In one line, this phase is about “Pushing your AI system to its limits”.
Interestingly, depending on which of the three phases your AI project is
in, it has huge implications on the kind of AI talent you need for that
phase. We will cover this in another article.
Impact of chatGPT/LLMs
Let us now understand how LLMs (chatGPT, Claude, Cohere etc) or any off
the shelf foundational models has impacted this curve. Now owing to
commoditization of chatGPT/ LLMs, (via APIs), one gets high degree of
“intelligence” off the shelf (but not 100% - even these systems make a
lot of mistakes) without any training what so ever.
This means, using any of these off the shelf solutions, today a smart
Product Manager (PM) with an hungry Business Leader (BL) can assemble a
v0 solution without necessarily involving an AI team. They along with a
street smart aspiring engineer can do enough prompt engineering to
quickly assemble together an AI system within 7-10 days which good
enough to demo in the market. Recall, this was the very objective of O-A
phase.
They can now use the demo sell their ‘solution’ aggressively and test
the market - are your users loving the solution? Are they willing to pay
for it? How much are they willing to pay etc which is one of the most
impotent parts of the first phase O-A.
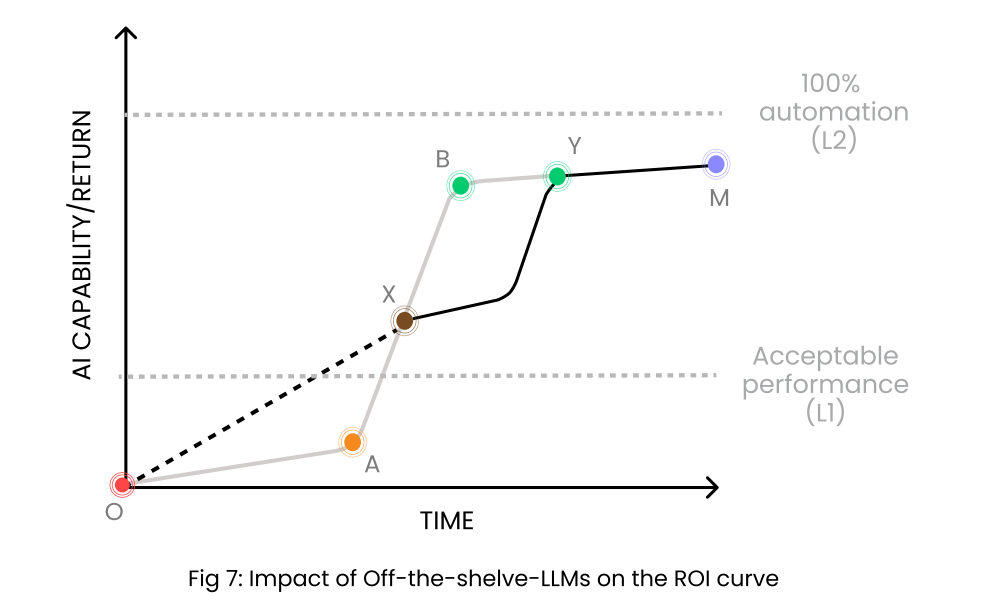
Let us understand the above in terms of the curve. Using chatGPT/off the
shelf LLMs via API - one can get fairly high intelligence. This is
represented by point ‘X’ in Figure 7. And since one can get to it very
quickly, we have a straight line from pt ‘O’ to pt ‘X’. In most cases,
this much intelligence is good enough to start selling your
product/offerings in the market
At some point in time, as your paying customers go up, they will be more
demanding in term of model accuracy. Now chatGPTs of the world are generic
systems trained on generic data, hence no matter how much prompt
engineering you do, they will take you only so far. To improve your
systems further, your next logical choice will be to fine tune open source
foundational models on your data. This will require you to gather data,
build your own datasets. What after that? trained your own foundational
models from scratch. Note this exactly the journey we saw from O-A-B-M in
Fig 4. only difference now will be the accuracies/ML metric values will be
much higher, hence the curve now takes the same shape beyond ‘X’.
It is important to call out that today AI is niche technology and is a
rapidly evolving landscape. In times to come, owing to commoditization,
both cost and time to develop AI systems will come down drastically. Then
the curve could look very different.
It turns out that using this curve one answer some very crucial questions - what is the right process to develop AI
systems, from a talent acquisition purpose when is the right time to
bring in AI scientist with PhD pedigree, why profit margin of AI companies will never be
more than 40% unlike SaaS companies that have 80-85% margins and many more.
We will answer these and many more in next set of articles. Adios until then.
*****
References
[1] New survey shows AI and ML are still nascent. https://content.alegion.com/blog/new-survey-shows-ai-and-ml-are-still-nascent. Survey by Alegion
[2] S. Ransbotham, S. Khodabandeh, R. Fehling, B. LaFountain, D. Kiron, "Winning With AI", MIT Sloan Management Review and Boston Consulting Group, October 2019.